 |
|
Core Transcriptional Regulatory Circuitry in Human Embryonic Stem Cells
Acknowledgements References |
Oct4 and Sox2 are known to be involved in both gene activation and repression in vivo (Botquin et al., 1998; Nishimoto et al., 1999; Yuan et al., 1995), so we sought to identify the transcriptional state of genes occupied by the stem cell regulators. To this end, the set of genes bound by Oct4, Sox2, and Nanog were compared to gene expression datasets generated from multiple ES cell lines ( Abeyta et al., 2004; Brandenberger et al., 2004; Sato et al., 2003; Wei et al., 2005) to identify transcriptionally active and inactive genes (Supplemental Data Table S2). The results showed that one or more of the stem cell transcription factors occupied 1303 actively transcribed genes and 957 inactive genes.
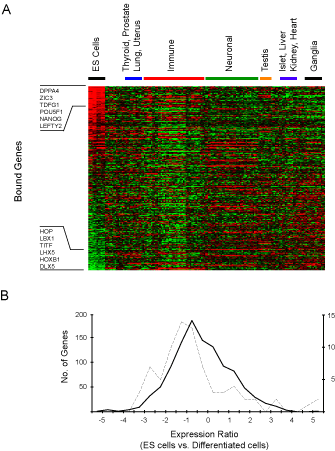
 Figure 3. Expression of Oct4, Sox2, and Nanog co-occupied genes. A. Affymetrix expression data for ES cells was compared to a compendium of expression data from 158 experiments representing 79 other differentiated tissues and cell types (Supplemental data). Ratios were generated by comparing gene expression in ES cells to the median level of gene expression across all datasets for each individual gene. Genes were ordered by relative expression in ES cells and the results were clustered by expression experiment using hierarchical clustering. Each gene is represented as a separate row and individual expression experiments are in separate columns. Red indicates higher expression in ES cells relative to differentiated cells. Green indicates lower expression in ES cells relative to differentiated cells. Examples of bound genes that are at the top and bottom of the rank order list are shown. B. Relative levels of gene expression in H9 ES cells compared to differentiated cells (described above) were generated and converted to log2 ratios. The distribution of these fold changes was calculated to derive a profile for different sets of genes. Data are shown for the distribution of expression changes between H9 ES cells and differentiated tissues for transcription factor genes that are not occupied by Oct4, Sox2 or Nanog (solid black line) and transcription factor genes occupied by all three (dotted line). The change in relative expression is indicated on the x axis and the numbers of genes in each bin are indicated on the y axes (left axis for unoccupied genes, right axis for occupied genes). The shift in distribution of expression changes for genes occupied by Oct4, Sox2 and Nanog is significant (p-value < 0.001 using a two-sampled Kolmogorov-Smirnov test), consistent with the model that Oct4, Sox2 and Nanog are contributing to the regulation of these genes. |
| YOUNG
LAB
Whitehead Institute 9 Cambridge Center Cambridge, MA 02142 [T] 617.258.5218 [F] 617.258.0376 CONTACT US |